Management Console
The GreptimeDB Enterprise Management Console extends the open-source GreptimeDB Dashboard with enterprise operational capabilities. The sidebar is organized into two groups:
| Group | Scope |
|---|---|
| Data Management | Query, ingest, and manage data — same features as the open-source Dashboard |
| Operation | Cluster observability and administration — enterprise only |
Data Management
Data Management covers query, ingest, pipelines, Flow, and Visualization — the same features as the open-source Dashboard. See GreptimeDB Dashboard for details.
Operation
Operation provides enterprise-only tools for cluster observability and administration.
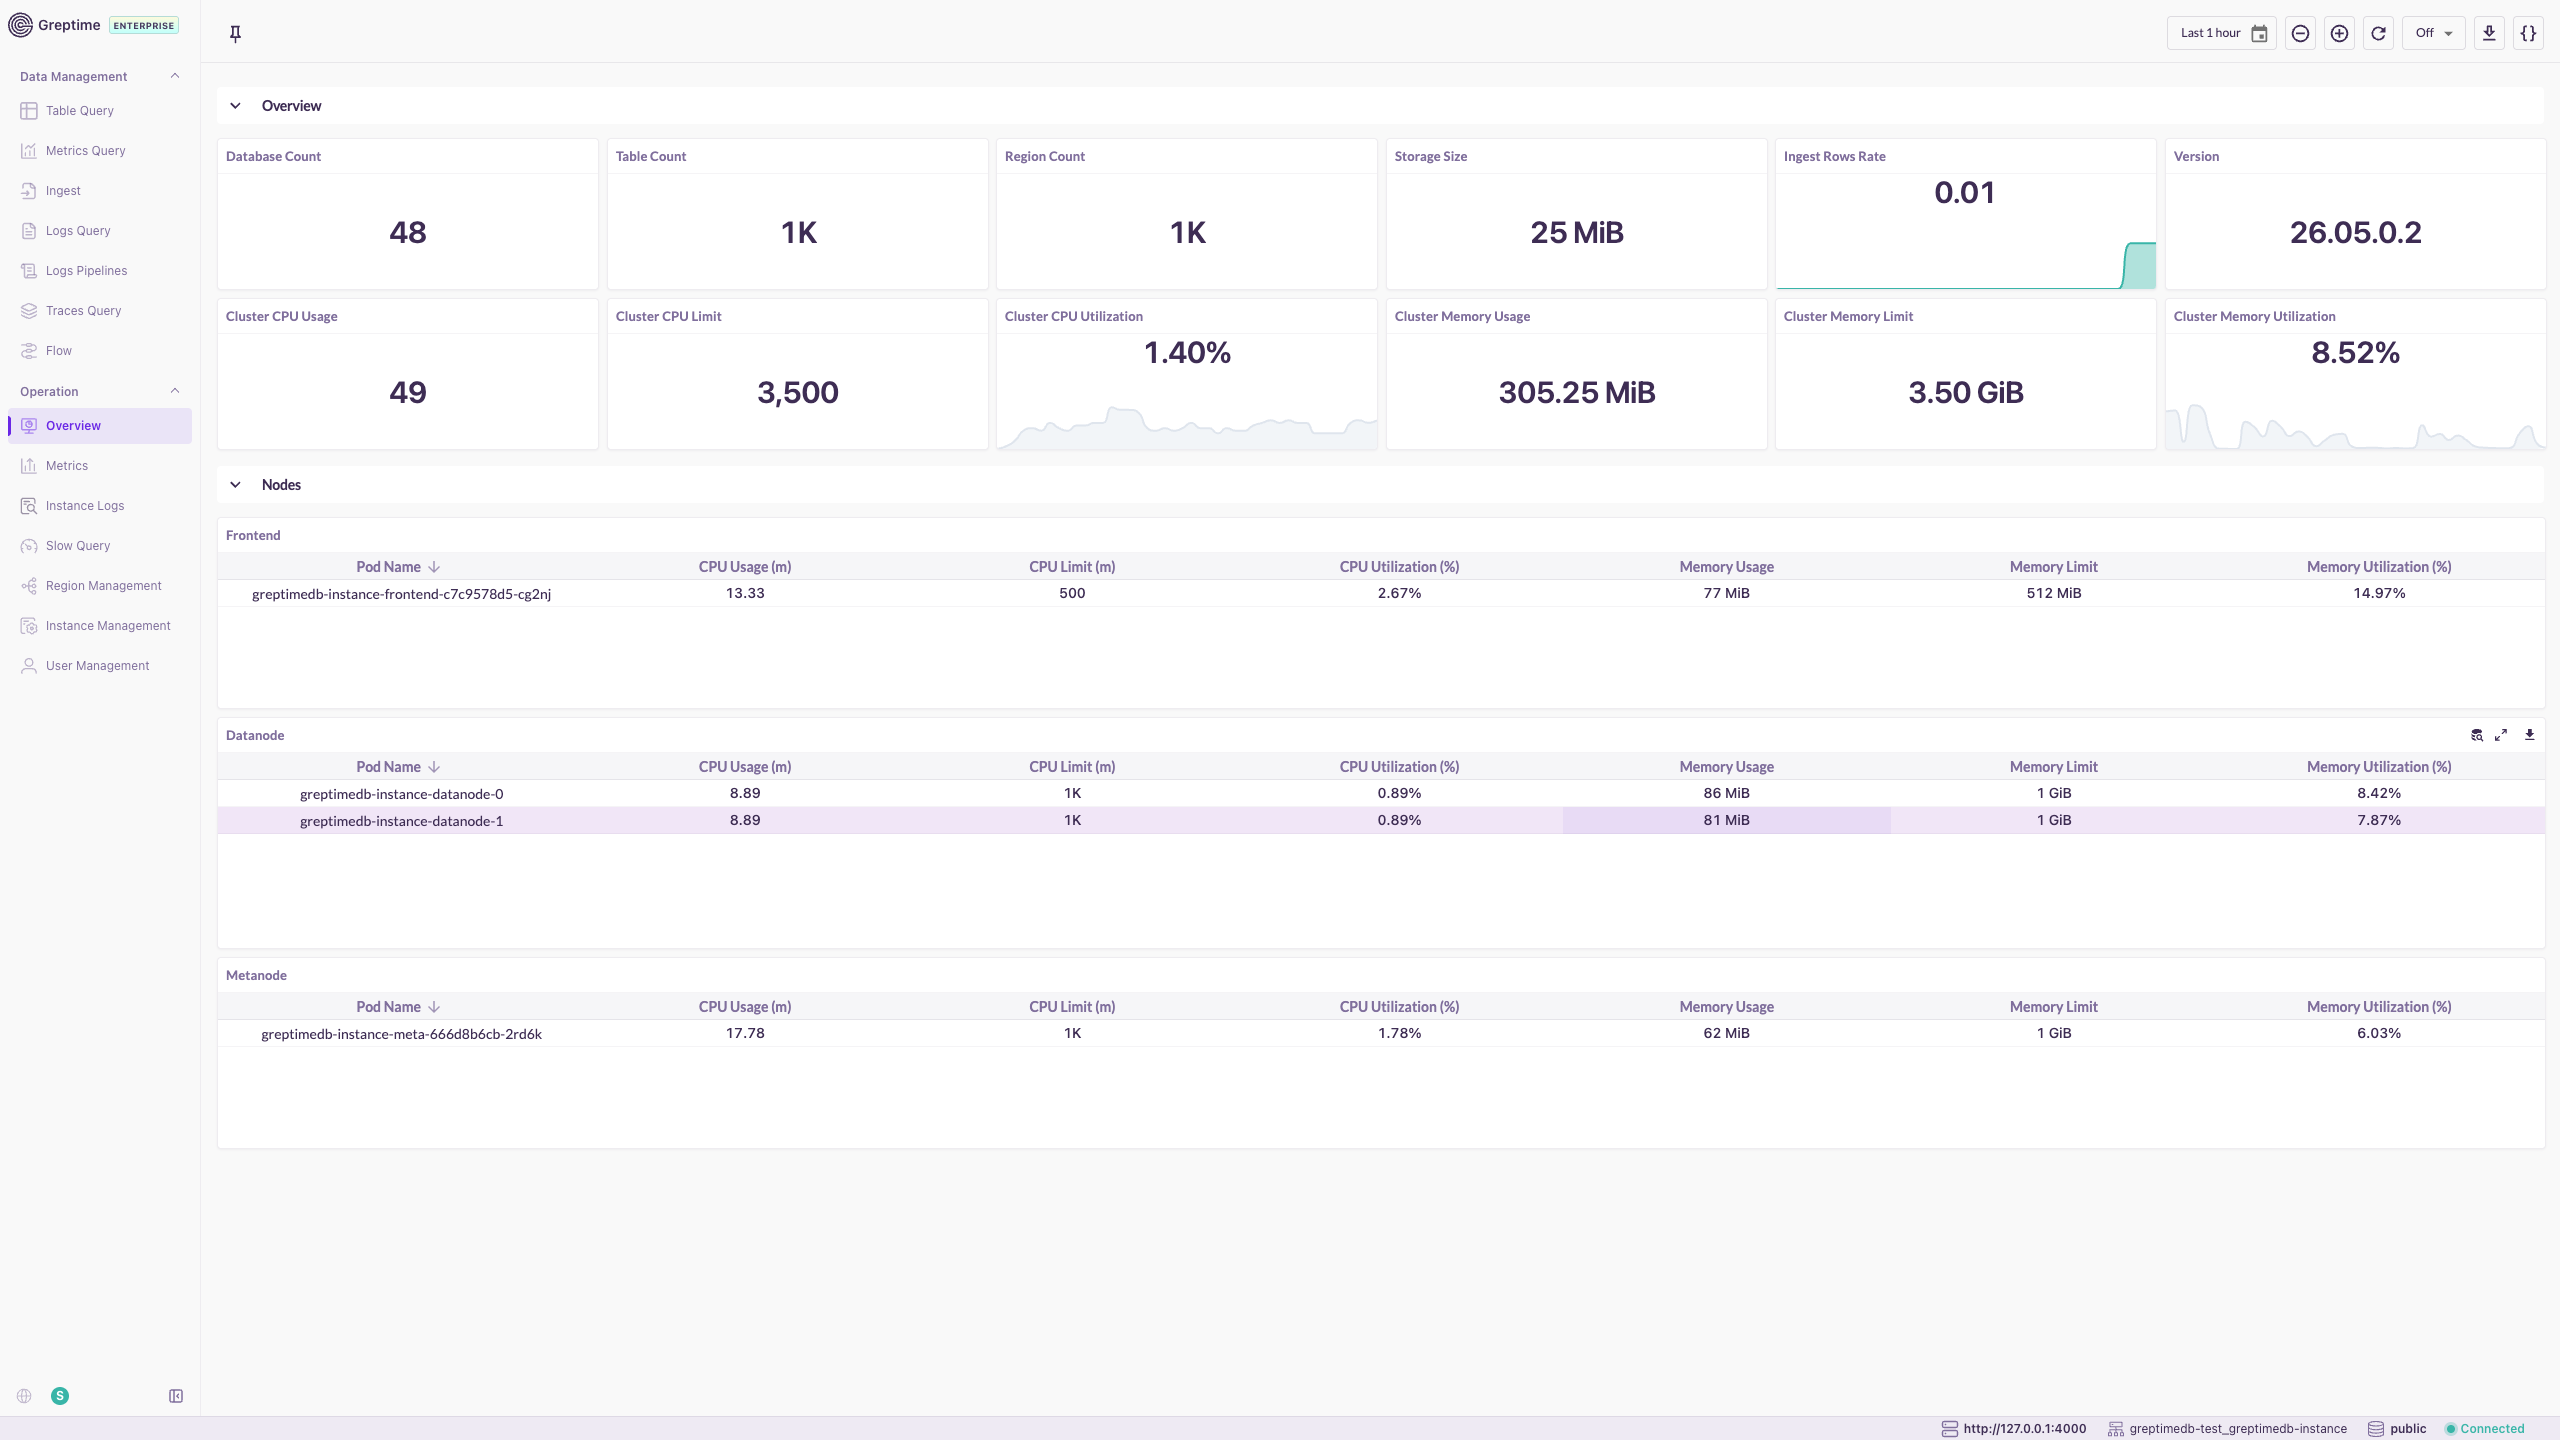
Overview
The Overview page displays cluster-wide status and resource usage.
- Database, table, and region counts; storage size and ingestion rate.
- Cluster CPU and memory usage with utilization trends.
- Per-node breakdown by role (Frontend, Datanode, Metasrv, Flownode).
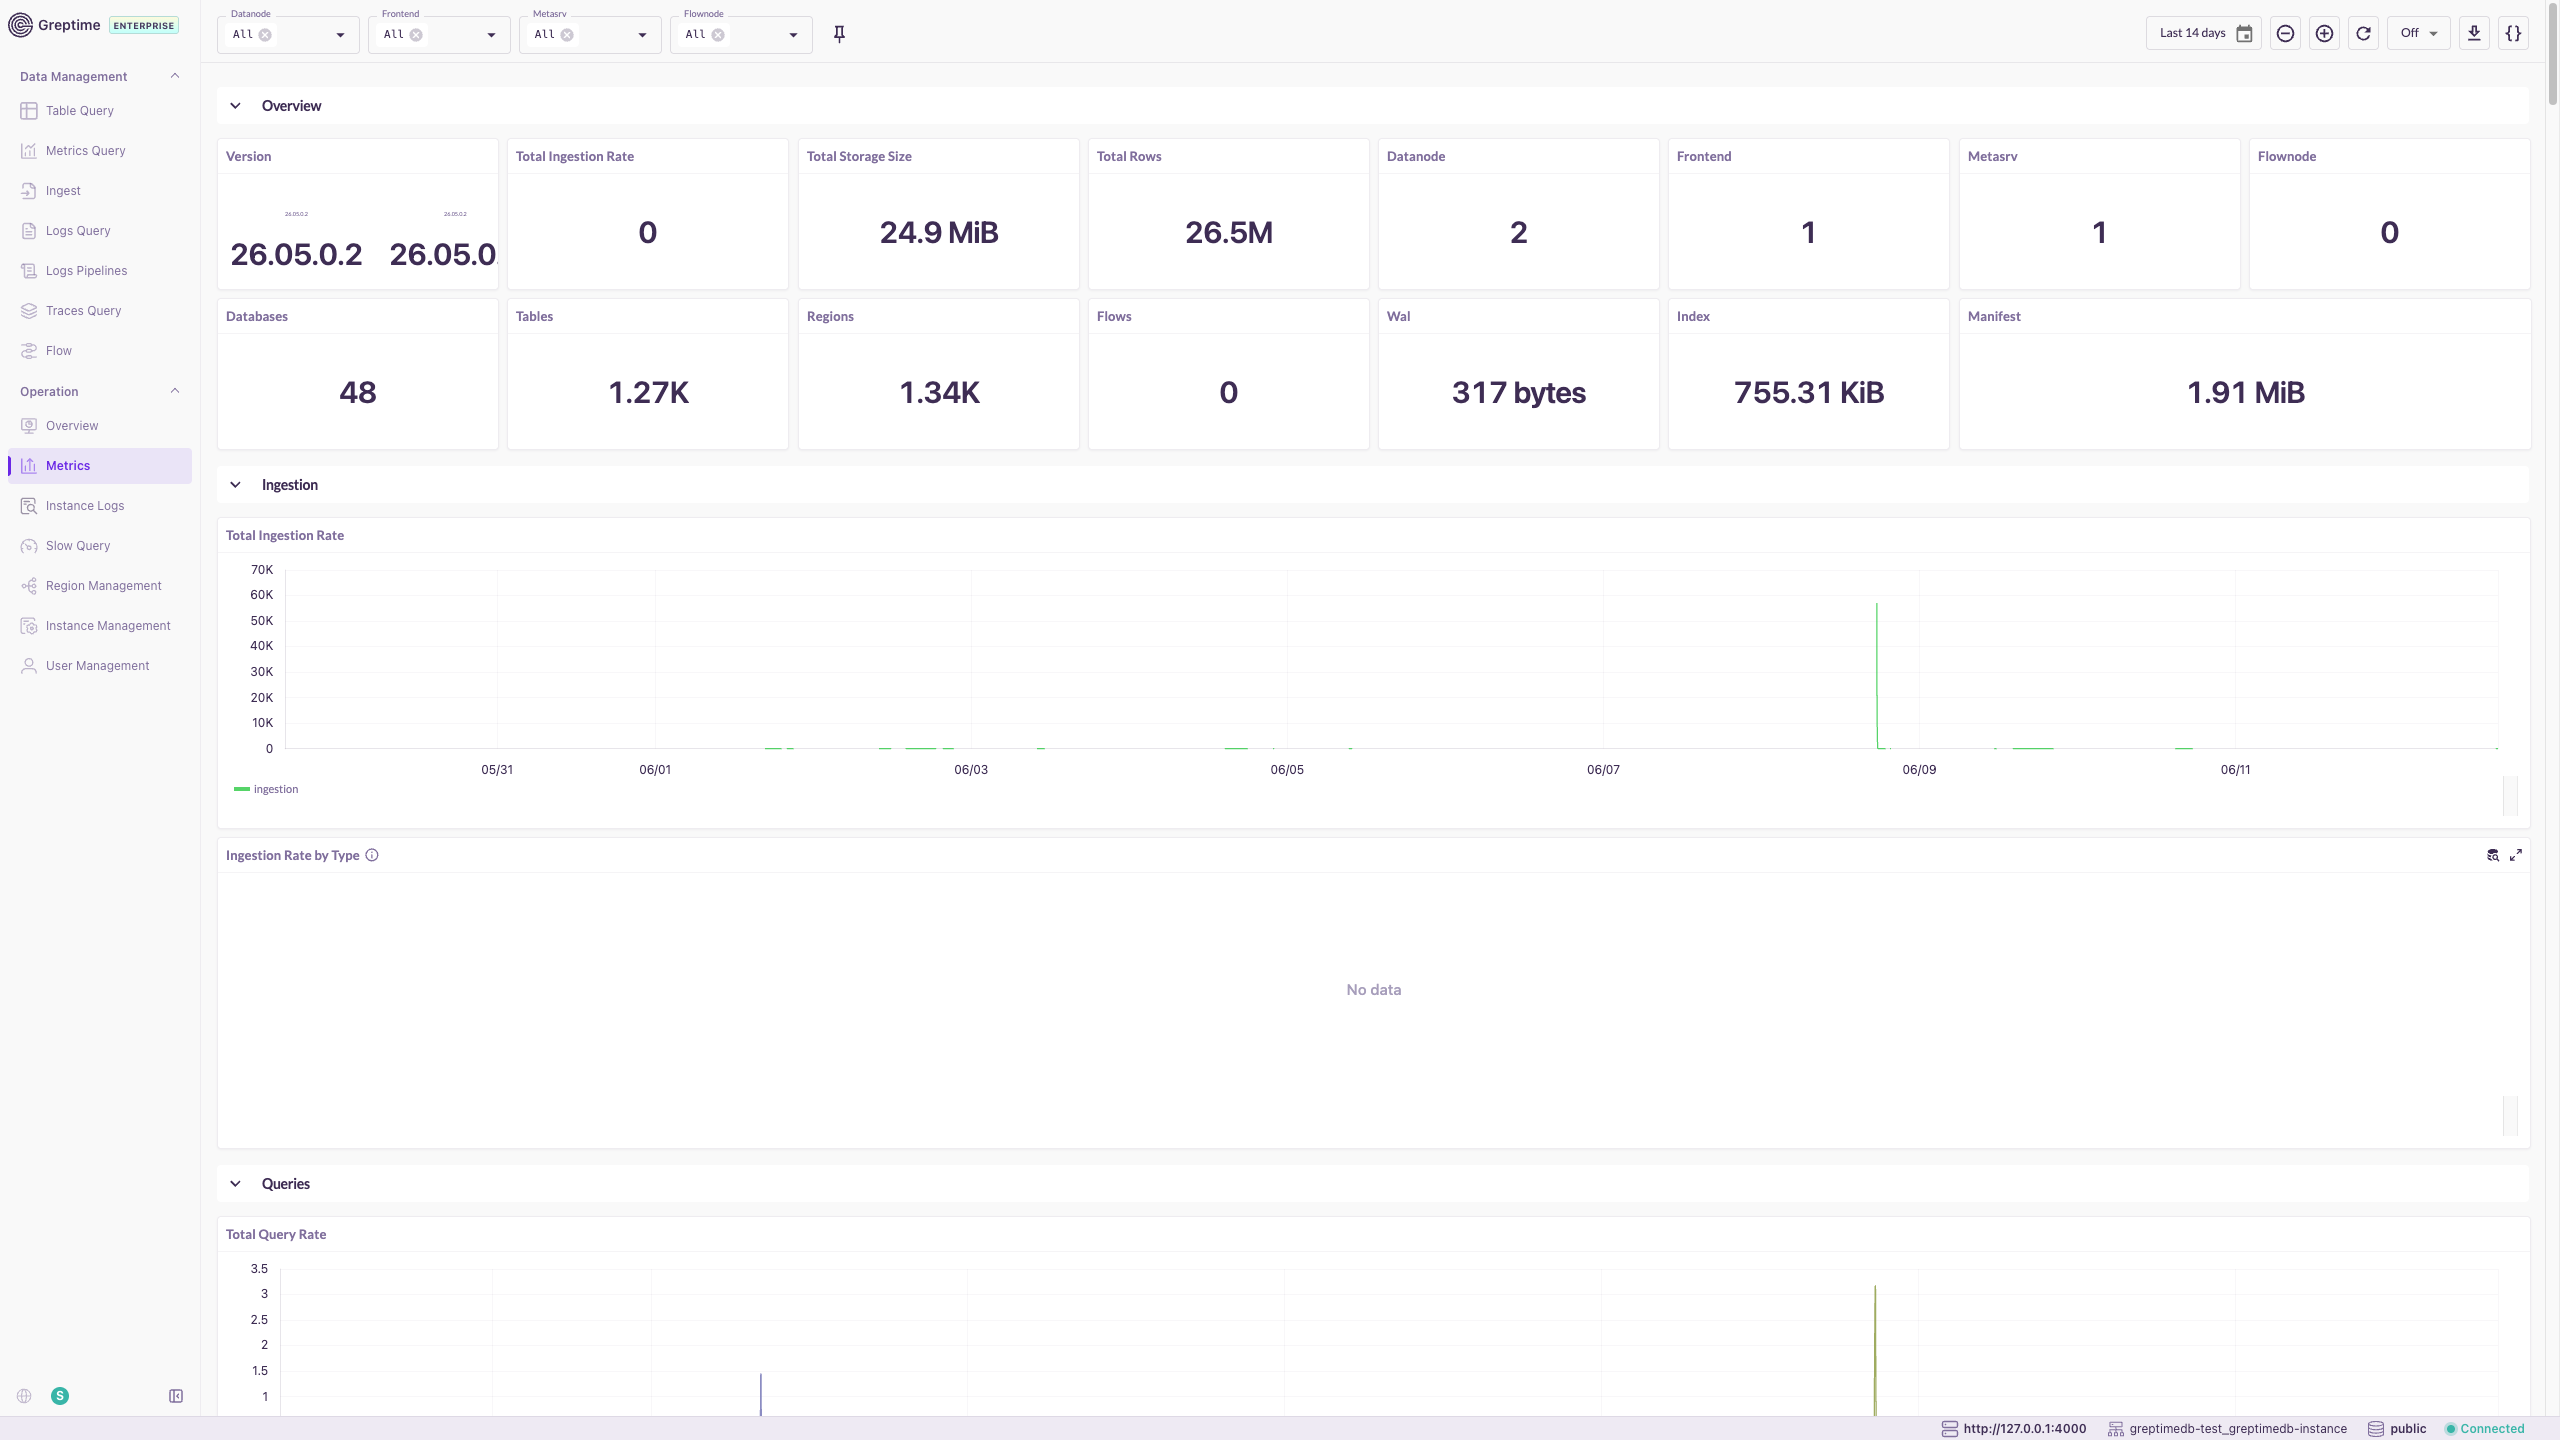
Metrics
The Metrics page shows cluster operational metrics in a single built-in monitoring view, organized into Overview, Ingestion, and Queries sections.
- Filter by node role and time range.
- Covers request rates, latency, storage, and resource utilization.
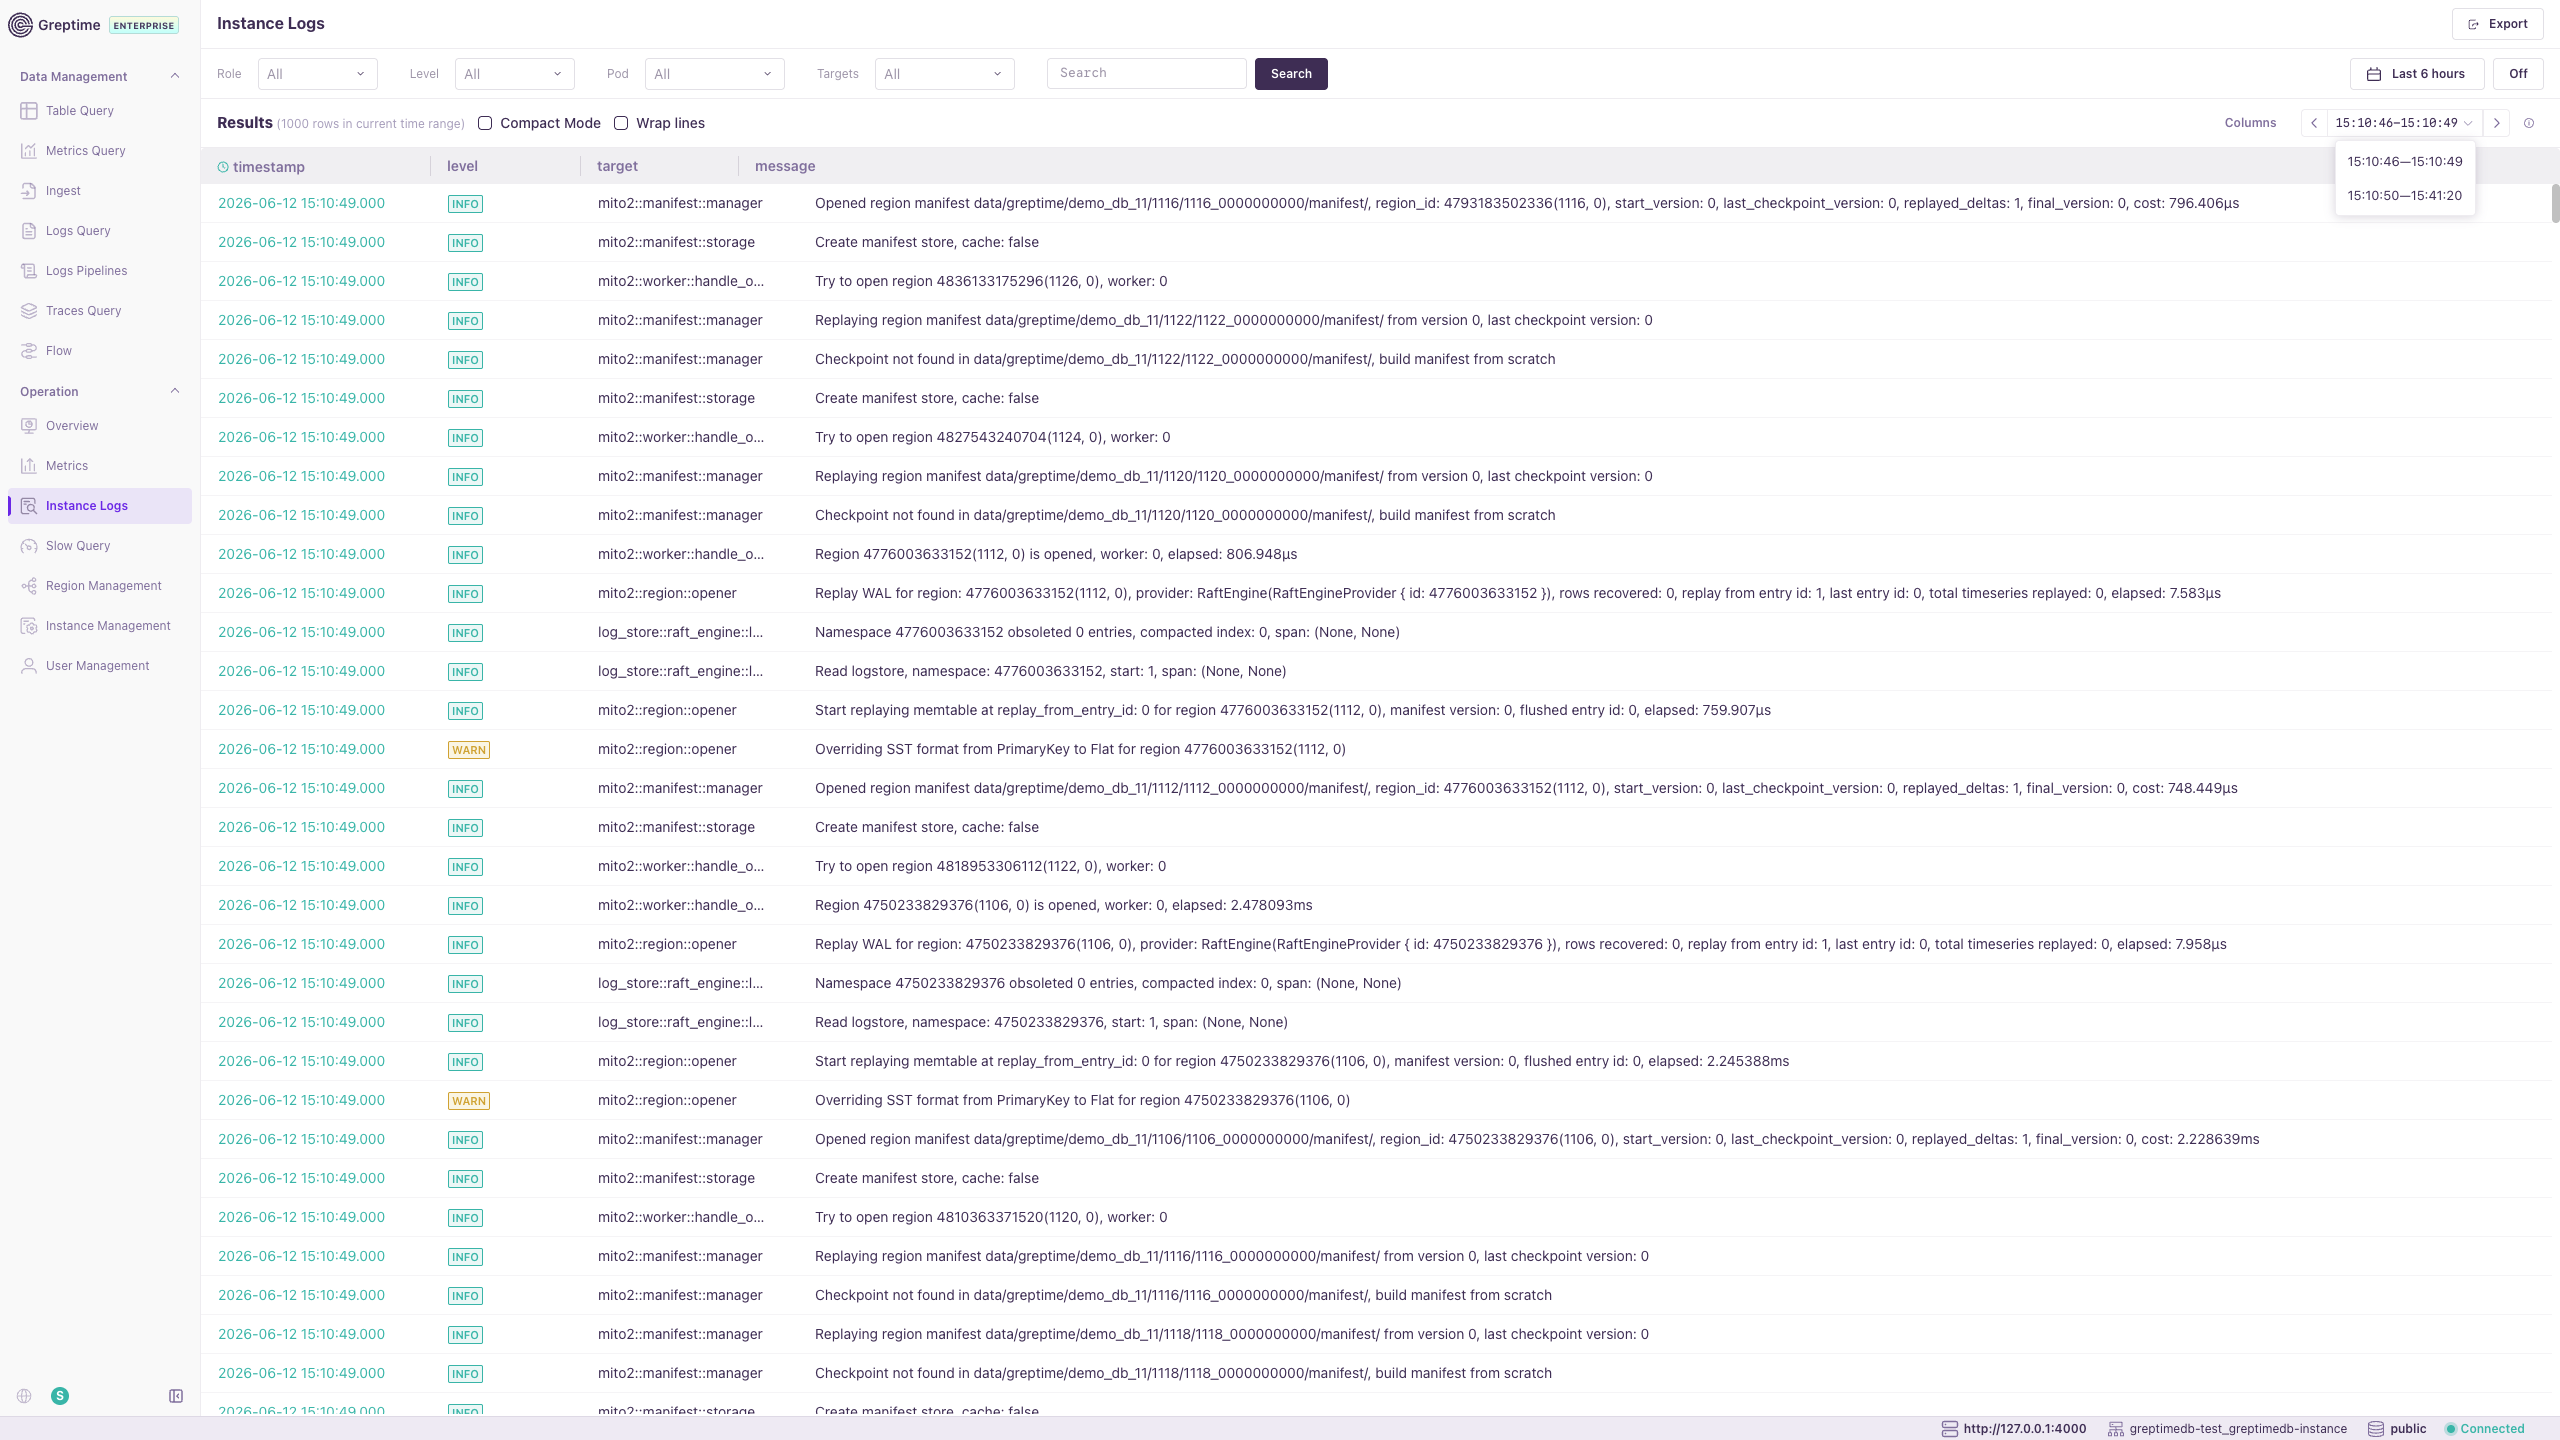
Instance Logs
Instance Logs enables log search and analysis for GreptimeDB components.
- Filter by role, instance, log level, time range, and keywords.
- Export results for further analysis.
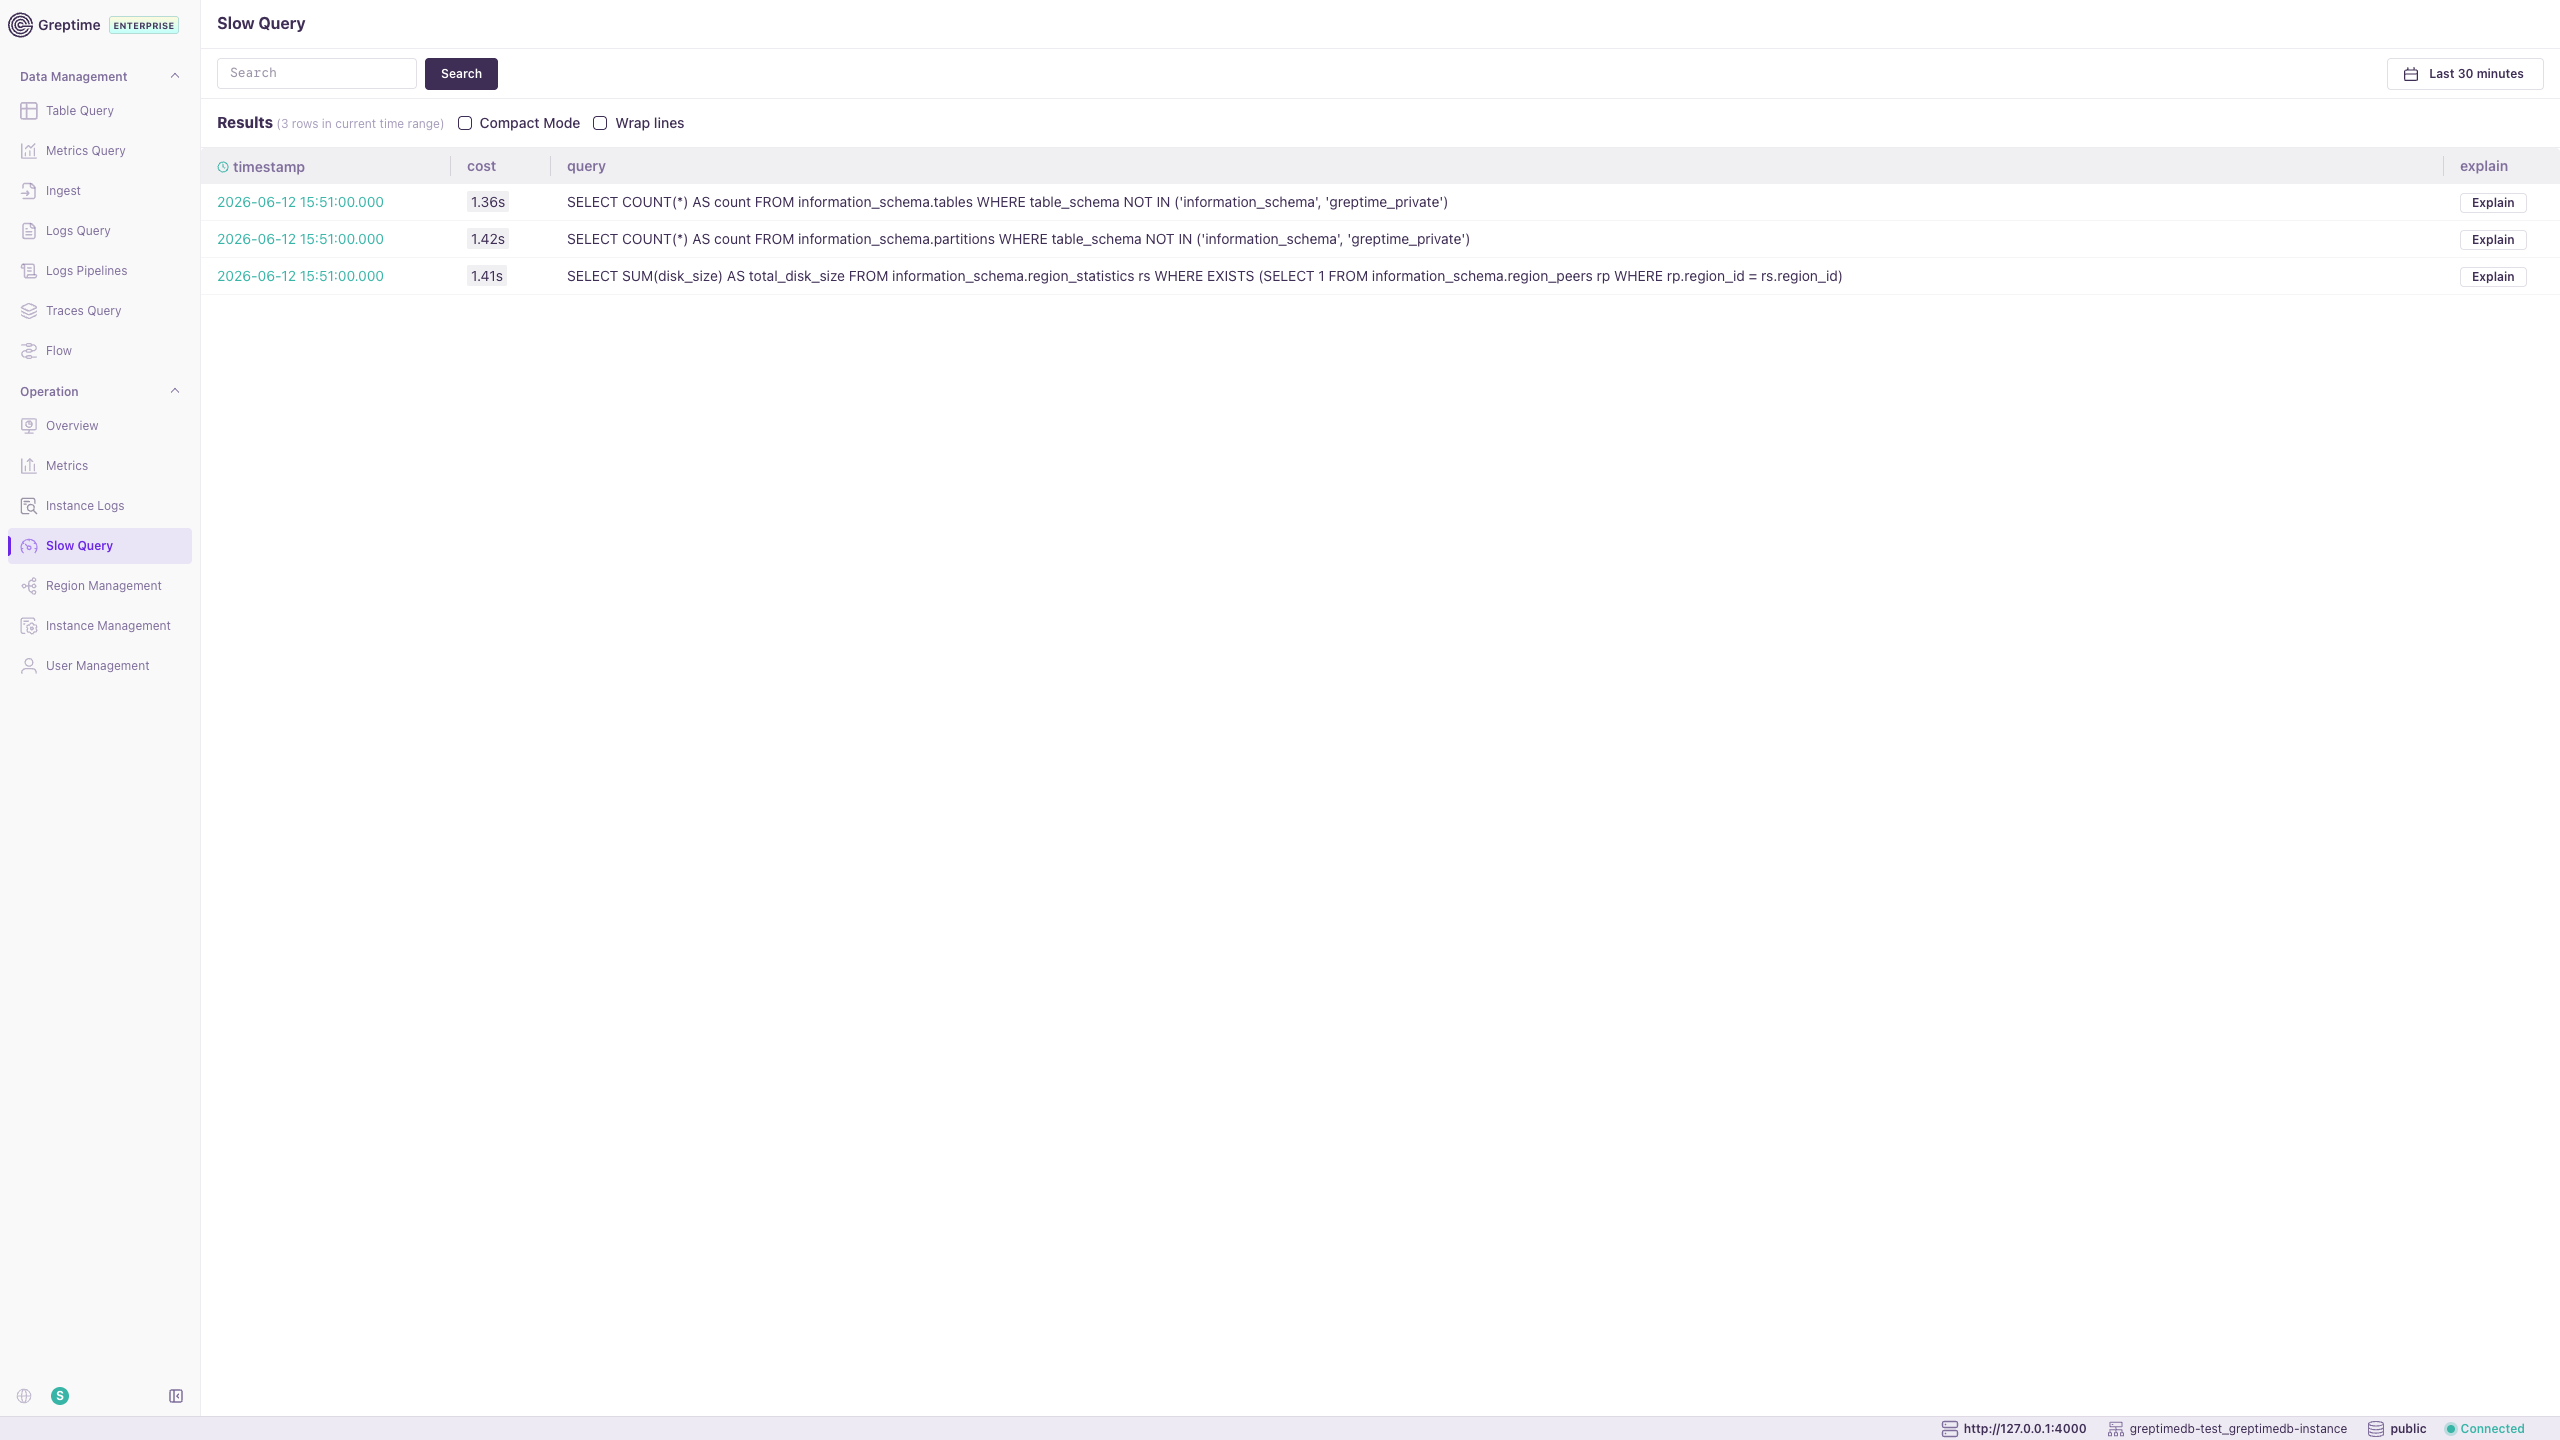
Slow Query
Slow Query lists long-running SQL and PromQL queries.
- View execution time and full query text.
- Use Explain Query to analyze execution plans and optimize performance.
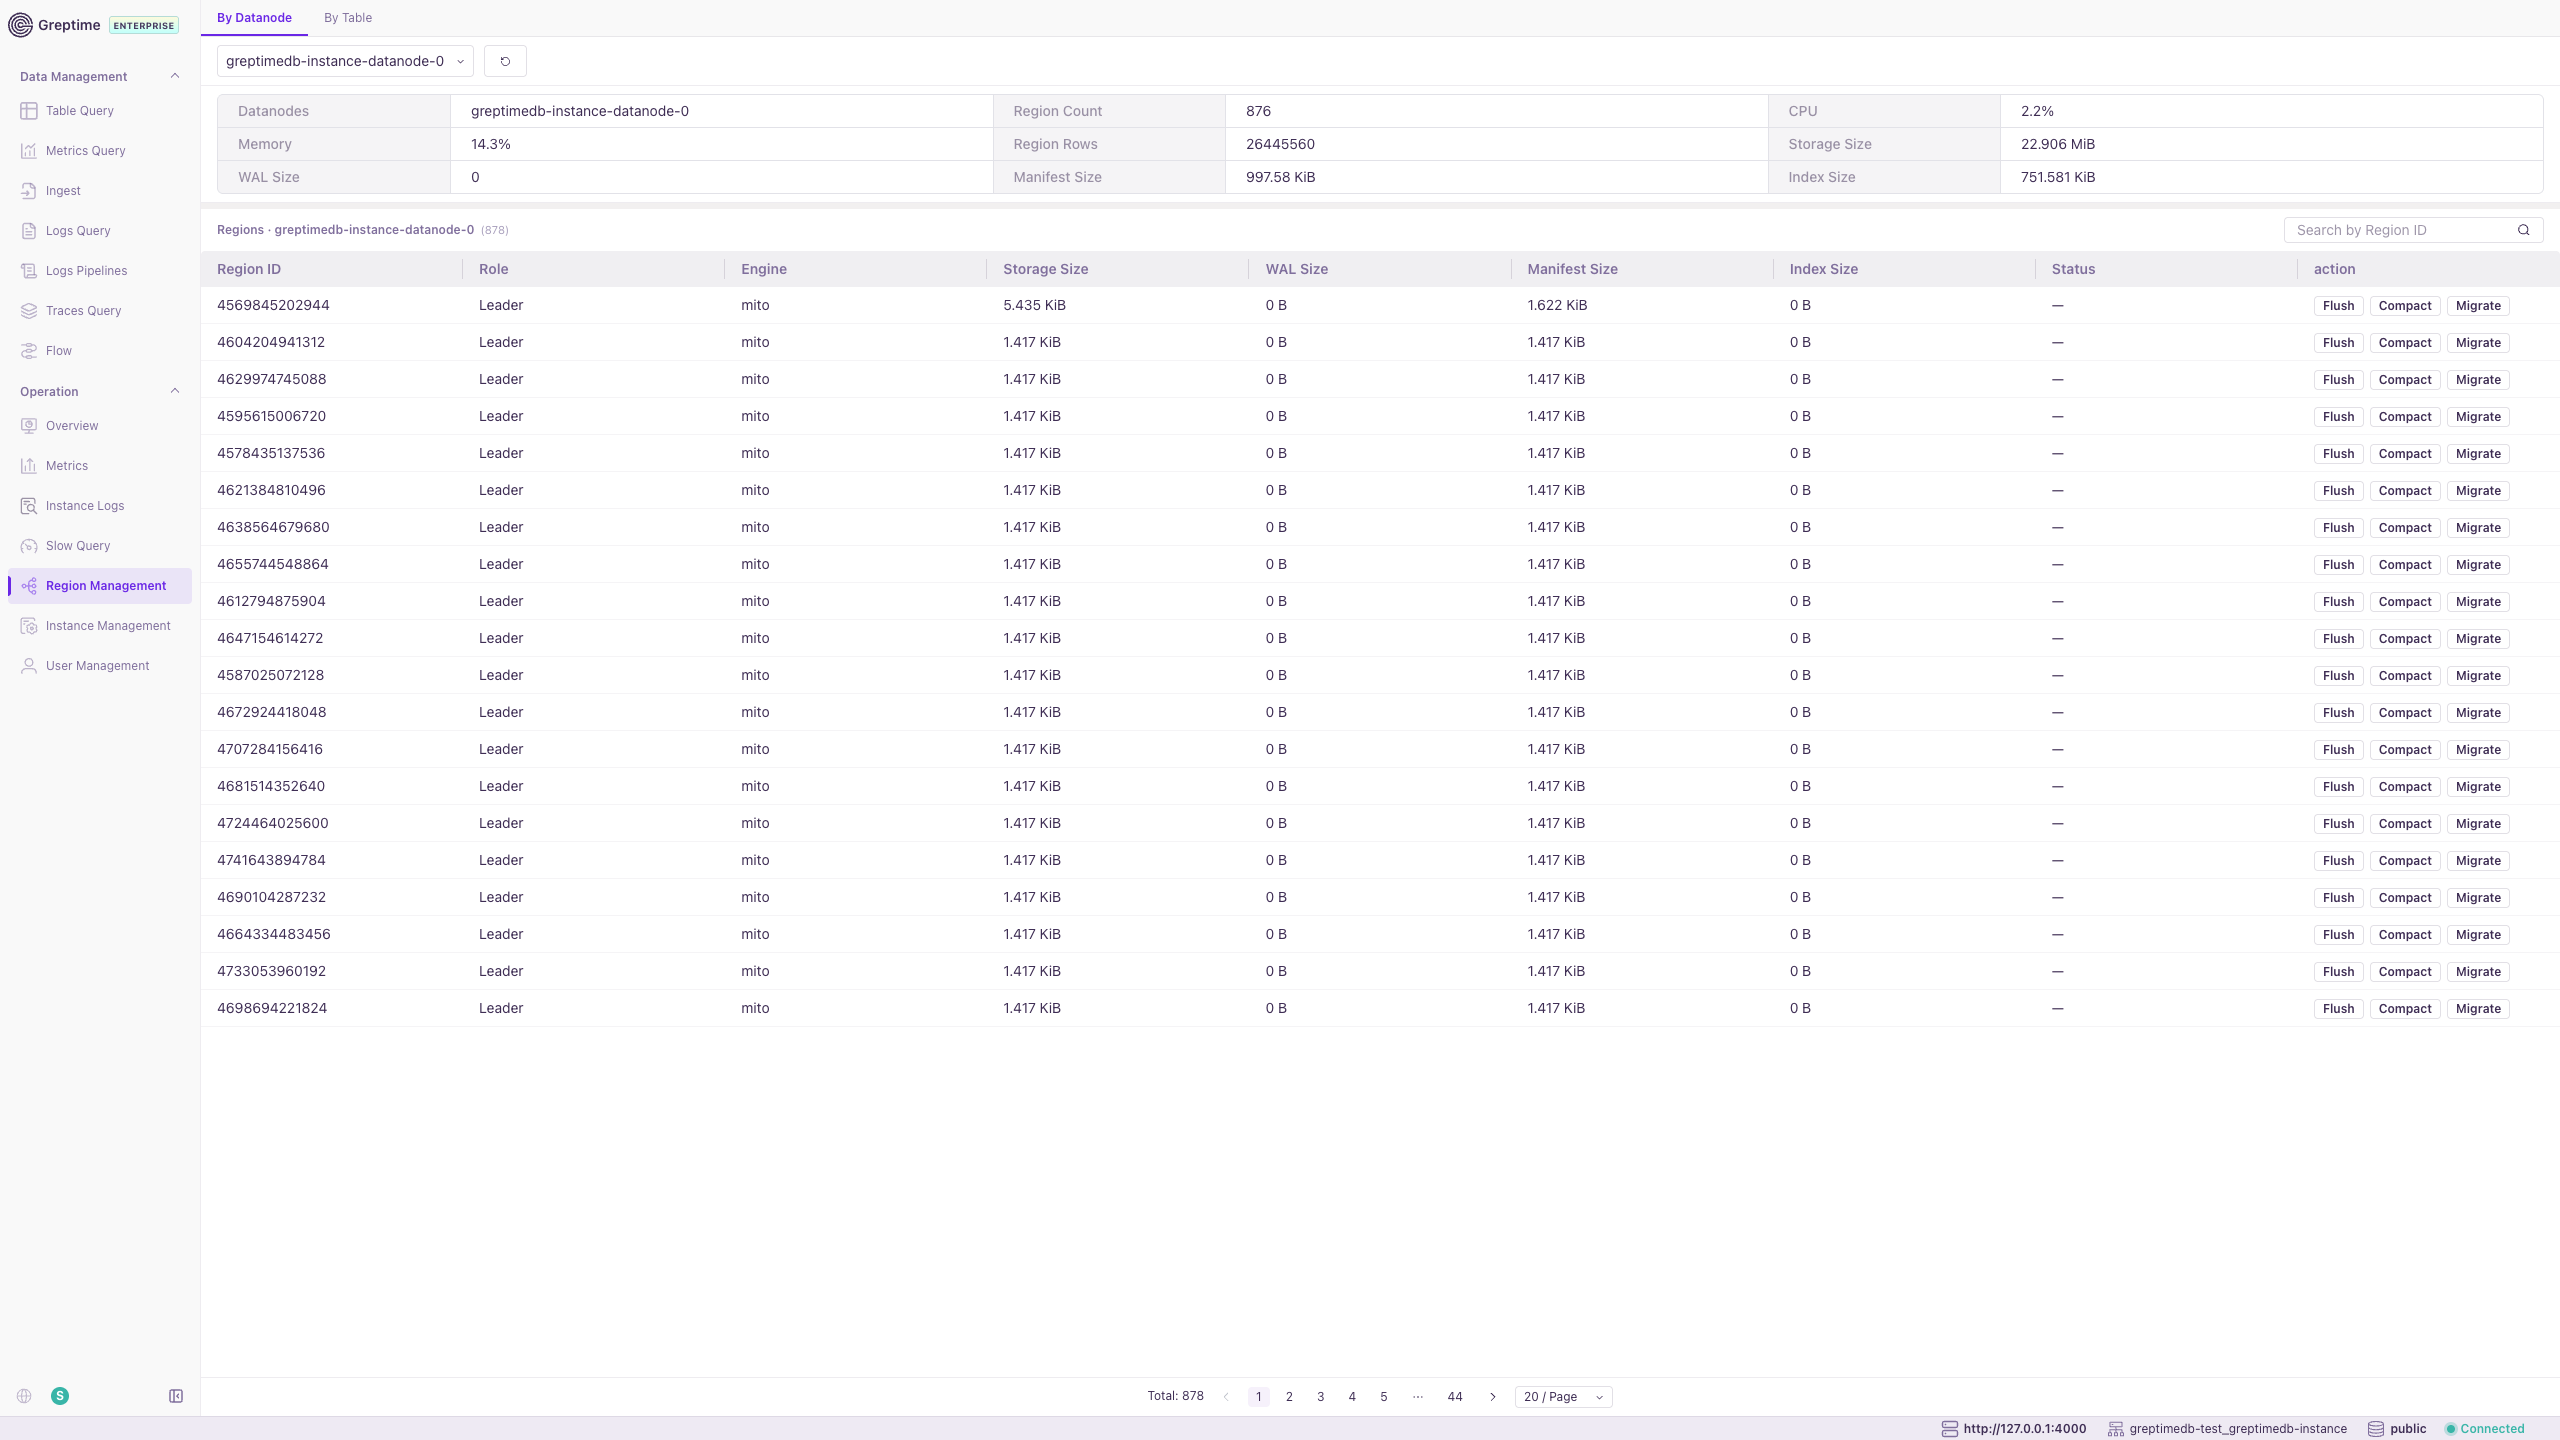
Region Management
Region Management provides region-level operational capabilities.
- By Datanode and By Table views for region distribution and details.
- Flush and Compact operations to optimize storage and performance.
- Migrate regions between nodes with progress tracking.
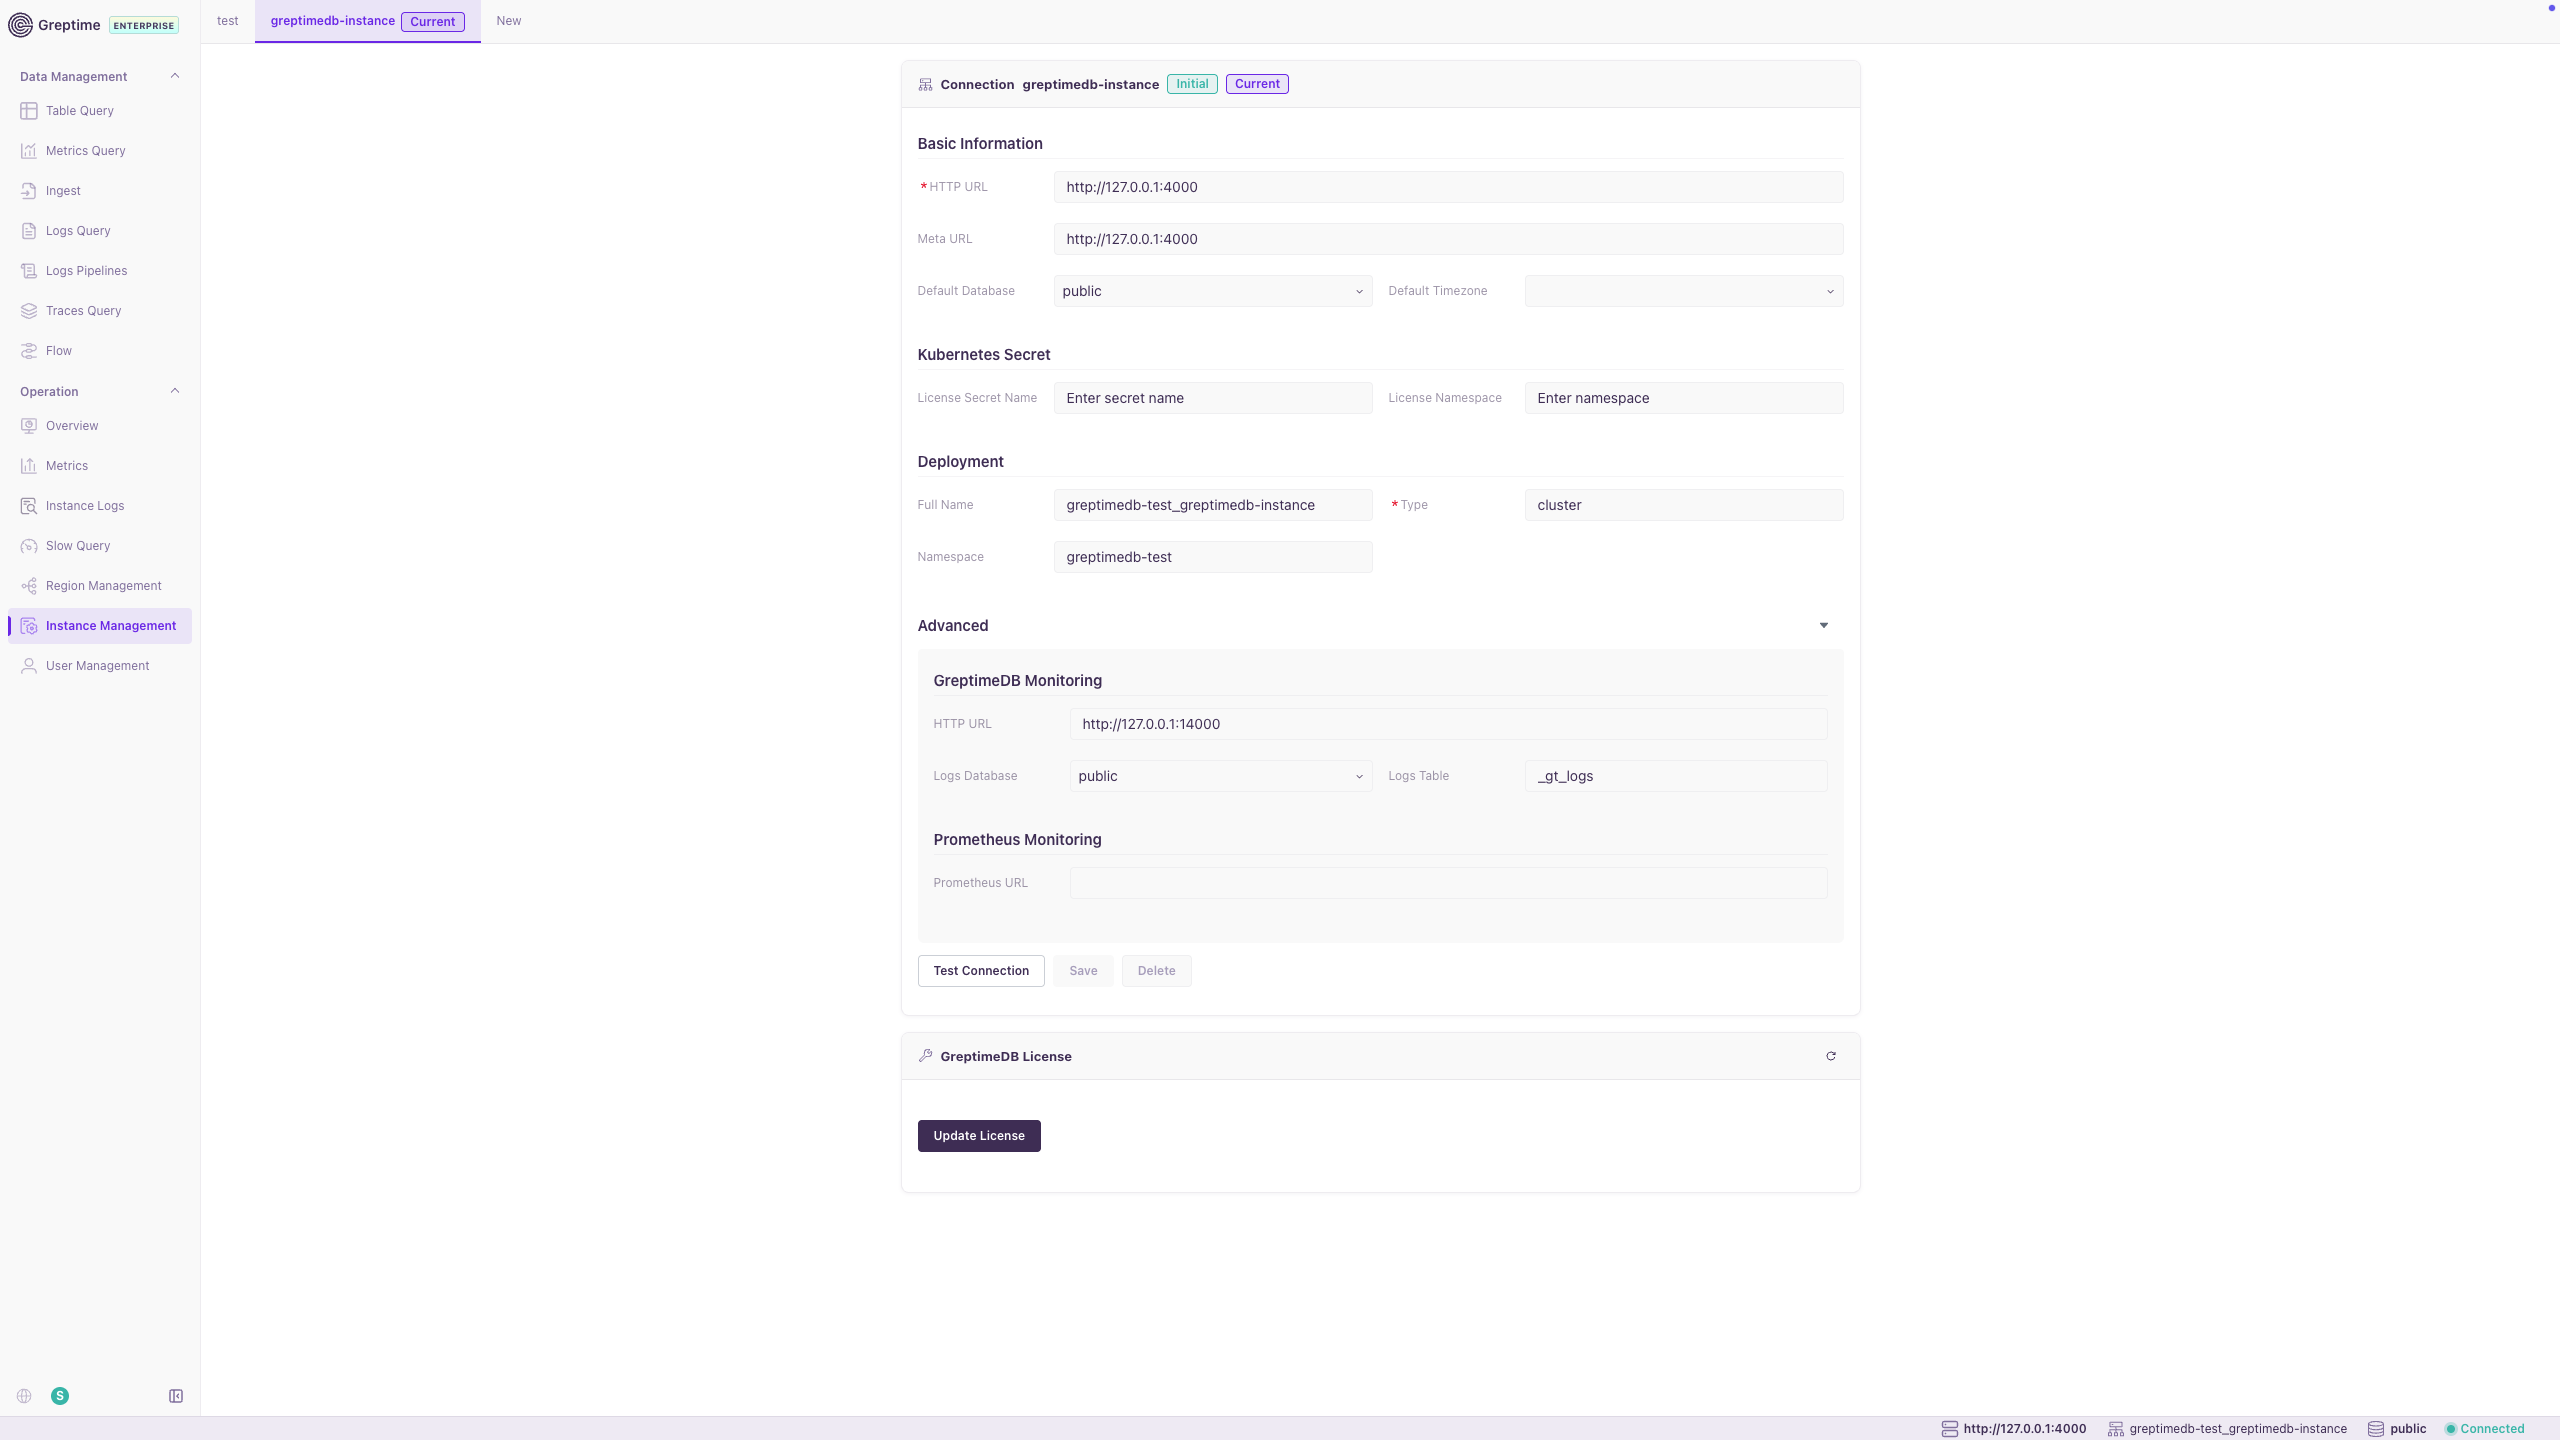
Instance Management
Instance Management configures connections to GreptimeDB clusters.
- Set HTTP URL, Meta URL, default database, and timezone.
- Configure Kubernetes license secrets and deployment metadata.
- Configure GreptimeDB and Prometheus monitoring endpoints.
- Test Connection, Save, and Update License actions.
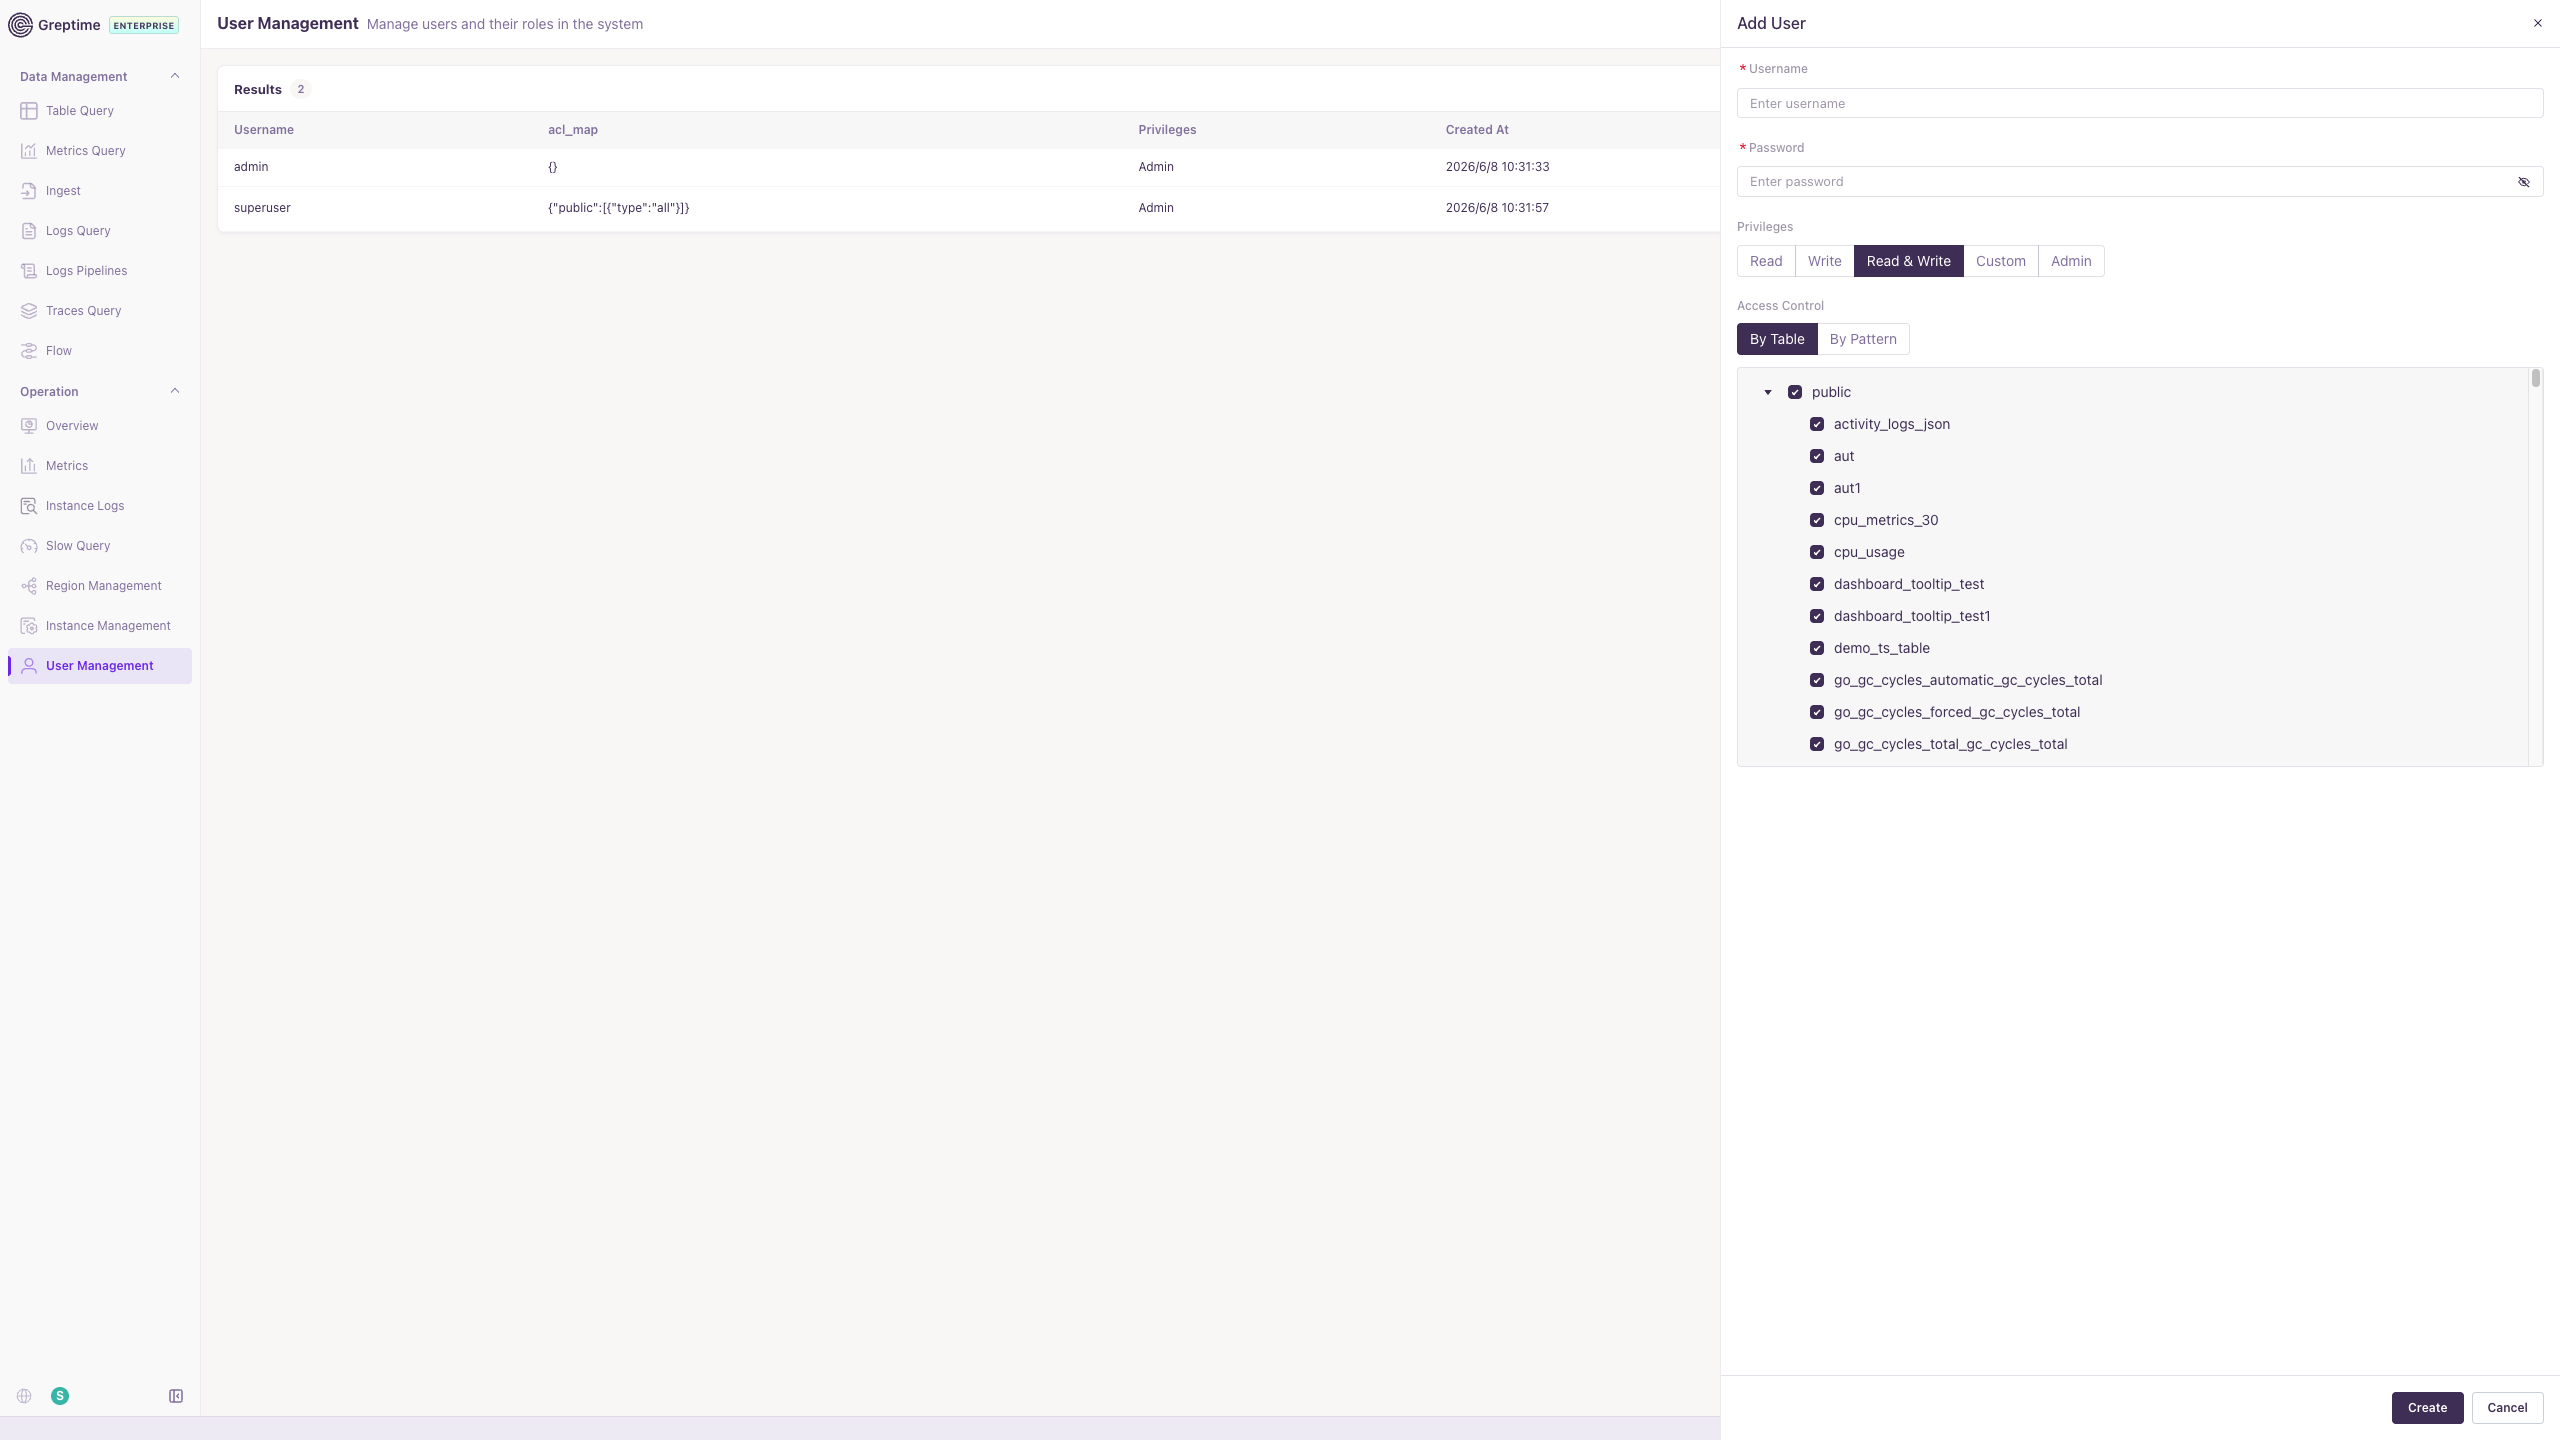
User Management
User Management manages user accounts and access control in the console.
- Create users and assign privileges (Read, Write, Read & Write, Custom, Admin).
- Configure table-level ACLs by table or pattern.
- For RBAC and ACL details, see Built-in User Management.
CPU and Memory Profiling
The sidebar provides Memory Profile and CPU Profile entries for continuous profiling of GreptimeDB components. For configuration and usage, see Continuous Profiling.